
Installing an Energy Management System gives a factory access to something it rarely had before: a continuous view of how electricity and other utilities are behaving across the facility. Instead of waiting for the monthly electricity bill, management can see current demand, accumulated consumption, production-area performance, historical trends, peak loads, power factor, alerts, and depending on the system architecture, water, gas, steam, compressed air, solar generation, and machine-level energy use.
The difficulty is that having a dashboard and knowing how to use it are two different things.
A factory manager opening an EMS for the first time may be presented with dozens of numbers, graphs, gauges, and notifications. Total energy today may be higher than yesterday. One production line may show the highest consumption. A demand graph may contain an unusual spike. Power factor may have changed. An alert may have appeared overnight. None of these observations automatically tells management whether the facility has an energy problem.
Factories searching for energy consumption dashboard software in Pakistan should therefore evaluate more than how visually impressive the interface looks. The real value of the dashboard is whether it allows the operating team to move systematically from a number on the screen to an informed question, investigation, and action.
This guide explains how factory managers can do that in practice.
Start With the Dashboard Hierarchy Before Looking at Individual Numbers

The first mistake when using an EMS dashboard is jumping immediately into individual machines or graphs without first understanding how the system is structured.
A useful industrial dashboard normally reflects the energy hierarchy of the facility. At the highest level is total plant consumption. Below that may be transformers, distribution boards, production departments, utility systems, production lines, and major individual assets. A factory with multiple buildings or sites may have another level above this hierarchy.
The purpose of moving through these levels is to narrow a problem progressively.
If total electricity consumption appears unusually high, the first question should not be, “Which motor is inefficient?” The better sequence is: Which area contributed to the increase? Within that area, which feeder, line, utility, or major asset changed? Did its operating conditions change as well?
This is one of the reasons industrial platforms increasingly support views at plant, area, device, and system level rather than presenting one plant-wide number. Siemens, for example, describes device-, area-, and system-level dashboarding alongside energy reporting and power-quality monitoring, while ABB supports consumption comparisons between groups and sites.
For a factory manager, this creates a simple rule: start broad and drill down only when the higher-level data gives you a reason to investigate.
Read kW and kWh as Two Different Questions
Two of the most common numbers on an electricity dashboard are also among the most frequently misunderstood: kW and kWh.
Kilowatts, or kW, represent power at a particular moment. On an EMS dashboard, this is usually your current or near-real-time electrical demand. It tells you how heavily the factory, department, or machine is drawing power at that time.
Kilowatt-hours, or kWh, represent energy consumed over a period. This is the accumulated quantity that builds across a shift, day, week, or month.
The distinction becomes important operationally.
Suppose a production area normally operates around 600 kW but suddenly rises to 850 kW. That increase in demand may justify investigation even if the total daily kWh has not yet changed significantly. Several large machines may have started at the same time, an additional compressor may have come online, or a process configuration may have changed.
Now consider the opposite case. Current demand may appear normal at 600 kW, but daily energy consumption could still finish considerably above the baseline because the equipment operated for more hours than usual.
One metric shows how hard the facility is drawing power now. The other shows how much energy it accumulated over time.
This is also why factory managers should resist opening the dashboard only once at the end of the month. The monthly kWh figure can tell you that something changed, but the demand profile may show when it changed and which part of the operating day created the difference.
Never Judge Consumption Without Looking at Production
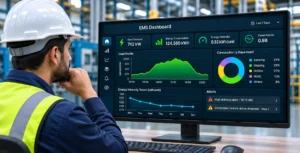
One of the most important habits when learning how to use an energy management dashboard is to stop treating higher energy consumption as automatically negative.
A factory that produces more will normally consume more energy.
If electricity consumption increased by 8% but production increased by 15%, energy performance may actually have improved. Conversely, if energy consumption remained unchanged while output dropped significantly, efficiency may have deteriorated even though the electricity graph appears stable.
For this reason, factory managers should pay close attention to energy intensity, sometimes presented as an Energy Performance Indicator or EnPI.
The exact metric depends on the process. It may be:
kWh per tonne
kWh per unit
kWh per batch
kWh per metre of fabric
kWh per production hour
or another operationally meaningful denominator.
Current manufacturing EMS guidance increasingly emphasizes energy intensity because it normalizes consumption against output and prevents management from mistaking higher production for poor efficiency.
Imagine two production days:
Monday uses 18,000 kWh to produce 20,000 units.
Tuesday uses 19,500 kWh to produce 24,000 units.
Tuesday consumed more electricity in absolute terms. Yet Monday used 0.90 kWh per unit, while Tuesday used approximately 0.81 kWh per unit.
From an energy-performance perspective, Tuesday was better.
This is why an EMS becomes much more useful when energy data can be evaluated alongside production information rather than viewed as a separate utility record.
Use the Load Profile to Understand What Happened During the Shift
A daily total gives you one number. A load profile gives you the story behind that number.
The typical electricity trend graph shows demand across time. Depending on the dashboard, the interval may be seconds, minutes, fifteen-minute periods, or another configured frequency.
Factory managers should learn what a normal operating day looks like.
When does the plant begin loading up before production? When do major production lines start? What happens during lunch breaks or shift changes? Does consumption fall during planned downtime? What is the normal night-time load? What happens when production stops?
Once a normal pattern becomes familiar, abnormal behaviour becomes easier to recognize.
Suppose production finishes at 10:00 p.m., but the load profile remains unusually high until midnight. The dashboard may be exposing equipment that is not shutting down when expected.
Suppose the normal minimum night load is 180 kW but gradually rises to 250 kW over several weeks while production schedules remain unchanged. That change may deserve investigation.
Research on energy-dashboard use commonly identifies persistent night-time or weekend demand as a useful indicator of possible out-of-hours waste, although operating context must always be checked before classifying it as unnecessary consumption.
In a factory, legitimate baseload may include servers, safety systems, refrigeration, process equipment, ventilation, pumps, or other systems that genuinely need continuous operation. The dashboard cannot decide that every night load is waste. Its role is to make the pattern visible enough for management to ask why it exists.
Pay Attention to Peak Demand, Not Just Total Consumption
A factory can have acceptable overall energy consumption and still operate with an unnecessarily poor demand profile.
Peak demand is the highest level of power drawn during a relevant interval. The exact financial impact depends on the facility’s applicable tariff and billing structure, so factory managers should always interpret the EMS alongside their own utility bill and tariff conditions rather than assuming every visible spike creates the same cost consequence.
Operationally, however, repeated demand spikes are still useful information.
A dashboard may reveal that several large systems consistently start during the same period. Compressors, chillers, production machinery, HVAC equipment, pumps, and other heavy loads may all contribute to a short but significant increase in plant demand.
This should lead to an operational question: Did these loads genuinely need to operate simultaneously?
If not, startup sequencing or operating schedules may deserve review.
Modern industrial energy software commonly treats peak monitoring as a separate dashboard function. ABB describes group peak monitoring against contractual power, while Siemens includes power-peak reports and demand analysis within its energy-management software.
The important point is not to panic every time the graph spikes. Instead, determine whether the event is normal, repeatable, avoidable, and financially or operationally significant.
Use Department and Asset Comparisons to Find Where the Change Came From
A good EMS should make comparison easier.
If total plant electricity increased by 10%, comparing departments can quickly show whether the change occurred everywhere or was concentrated in one area.
Suppose the plant contains spinning, weaving, utilities, HVAC, warehouse, and administration. Total consumption increases, but every area remains near its normal pattern except utilities.
That changes the investigation immediately.
Instead of reviewing the entire factory, engineering can begin with compressors, chillers, pumps, cooling systems, or other utility loads.
The same logic works at machine level.
Two similar machines producing similar output may have significantly different energy profiles. That difference does not automatically prove that one machine is inefficient; loading, product type, operating condition, speed, maintenance state, and process settings may differ. But the dashboard gives the team a reason to compare them.
Local Pakistan energy-monitoring providers increasingly emphasize this point-wise approach, allowing consumption to be viewed by machine, panel, line, or process rather than only at the incoming feeder.
For factory managers, comparison is often more useful than the absolute number. Knowing that a motor consumes 75 kW may mean little in isolation. Knowing that three comparable motors operate around 58–62 kW under similar loads while one consistently operates at 75 kW gives engineering something much more useful to investigate.
Understand Power Factor and Power Quality Without Treating Them as Energy Consumption
An EMS may show electrical parameters beyond kW and kWh, including voltage, current, frequency, reactive power, apparent power, power factor, and sometimes harmonic distortion or other power-quality indicators.
These parameters should not all be interpreted as different versions of energy consumption.
Power factor, for example, indicates how effectively apparent electrical power is being converted into useful real power. Low or deteriorating power factor can increase current requirements and may have cost or capacity implications depending on the utility arrangement and electrical system.
A factory manager does not necessarily need to diagnose the electrical cause directly from the dashboard. Instead, look for patterns.
Has power factor changed from its normal range?
Does deterioration occur only when certain equipment operates?
Is it concentrated on one feeder?
Is there a consistent relationship with certain shifts or loads?
Similarly, a power-quality dashboard may display voltage deviations, harmonics, sags, swells, or other disturbances. These should be investigated as electrical-performance issues rather than added directly to the energy-waste calculation.
Siemens and Schneider both distinguish energy-management views from power-quality monitoring and alarms, illustrating why these functions should be related but interpreted differently.
The EMS is useful because it helps identify when and where the electrical behaviour changed. Root-cause diagnosis may still require an electrical engineer or dedicated power-quality assessment.
Treat Alerts as Investigation Triggers, Not Automatic Conclusions
Alerts are one of the most useful parts of an EMS and one of the easiest to misuse.
A well-configured system might alert the team when consumption exceeds a threshold, demand approaches a limit, equipment runs outside scheduled hours, power factor deteriorates, a utility parameter deviates from its baseline, or communication with a meter is lost.
The presence of an alert does not necessarily mean energy is being wasted.
Imagine an alert stating that a production line is consuming 20% more energy than its historical average. Before concluding that the line is inefficient, management should check whether production increased, whether the product mix changed, whether an additional process step was operating, or whether maintenance work altered the normal schedule.
A useful alert therefore starts an investigation.
The factory manager should ask four questions:
What changed?
When did it change?
Was there a legitimate operational reason?
If not, what should engineering inspect?
This is also why too many alerts can become counterproductive. If every minor deviation generates a notification, teams eventually stop treating them as meaningful.
Thresholds should be refined as the facility learns more about normal operating behaviour.
Check Data Quality Before Trusting an Unusual Reading
Sometimes the most important thing visible on the dashboard is not an energy problem at all. It is a data problem.
A meter may stop communicating. A sensor may produce an unrealistic value. A communication gateway may go offline. A current transformer may have been configured incorrectly. A device replacement may change the scaling. Production information may be entered late. A dashboard may appear flat because data has stopped updating rather than because consumption remained perfectly stable.
Factory managers should therefore become familiar with the system’s normal data behaviour.
If a machine suddenly shows zero consumption while operators confirm it is running, that is probably not an extraordinary efficiency improvement.
If one feeder reports twice its normal value immediately after maintenance work, instrumentation or configuration should be checked before the plant changes its operating strategy.
Where dashboards display device status, communication status, timestamps, missing-data indicators, or online/offline states, these should be reviewed as part of routine use.
Energy decisions are only as reliable as the measurements behind them.
If Multiple Utilities Are Connected, Read Them Together
Industrial energy performance rarely depends on electricity alone.
Depending on the facility, an EMS may also monitor natural gas, water, steam, compressed air, diesel, solar generation, or other utility streams.
The real benefit appears when those readings can be connected.
Consider an air compressor.
Electricity consumption rises 12%, which initially looks inefficient. But compressed-air flow also rises 15% because production demand increased. The compressor may actually be performing normally.
Now consider electricity consumption rising 12% while compressed-air output remains almost unchanged. That deserves a different investigation. Pressure may have increased unnecessarily, leaks may have worsened, compressor sequencing may have changed, or the equipment may no longer be operating efficiently.
The same principle applies elsewhere.
Boiler fuel should be viewed against useful steam production.
Chiller electricity should be interpreted alongside cooling load and operating conditions.
Water consumption should be compared with production or process demand.
Solar generation should be viewed against plant load where the objective is to understand grid dependence or self-consumption.
This type of multi-utility context is increasingly standard in industrial energy platforms; ABB, for example, explicitly supports multiple energy services such as electricity, water, and gas within the same platform.
A Practical Daily Dashboard Routine for Factory Managers
A factory manager does not need to spend the entire day watching an energy dashboard.
The system becomes more useful when it is incorporated into a consistent operating routine.
Begin with the plant-level overview. Compare today’s consumption and current demand with a relevant reference such as yesterday, the same shift, or an established baseline. If production information is available, check energy intensity rather than total consumption alone.
Then review the load profile. Look for unusual start-up behaviour, unexpected peaks, extended operating hours, or loads that failed to fall when production stopped.
Next, identify which department or utility contributed most strongly to any abnormal change. Drill into individual equipment only where there is a reason to do so.
Review important alerts and determine whether they are operationally justified.
Check whether major meters and sensors are online so that decisions are not being made from incomplete information.
Finally, record any issue that requires investigation rather than assuming someone else will remember it.
This does not need to become a separate bureaucratic process. The most useful dashboard review can form part of the plant’s existing operations, maintenance, or production meeting.
Weekly and Monthly Reviews Should Answer Different Questions
Real-time dashboards are useful for immediate operating decisions, but not every energy problem needs to be solved in real time.
Daily review should focus on abnormalities that require attention now: unexpected demand, equipment running when it should not, active alerts, unusual utility behaviour, or systems that have stopped communicating.
Weekly review should focus more on patterns. Which areas repeatedly exceeded their baseline? Which machines consistently consumed more than comparable assets? Did night-time baseload increase? Were demand peaks concentrated during certain shifts? Did corrective actions taken earlier in the week produce a visible change?
Monthly review should move toward management-level performance.
How has energy intensity changed?
Which Significant Energy Uses improved or deteriorated?
How did energy cost change relative to production?
Did a completed efficiency project actually deliver the expected result?
Are any dashboards, meters, or KPIs no longer aligned with how the factory operates?
Which improvement opportunity should receive engineering or capital attention next?
This separation prevents the management dashboard from becoming an alarm screen and prevents the operational dashboard from becoming a monthly reporting tool.
The Dashboard Should End With an Action, Not an Observation
The biggest risk with energy consumption dashboard software is that it becomes another screen people occasionally look at.
A manager sees that compressor electricity increased.
An engineer sees that weekend consumption is high.
Management sees that one production line uses more energy than another.
Everyone agrees that the graphs are interesting.
Nothing changes.
That is not energy management.
A useful dashboard review should create a closed loop:
Observe → Compare → Investigate → Act → Verify

Suppose the EMS shows that a production area maintains a high baseload after the shift ends. Engineering investigates and finds that an extraction fan remains on because of an old operating schedule.
The schedule is corrected.
The dashboard should then be used again to verify whether night consumption actually fell.
This final step is critical because an action marked “completed” does not necessarily mean the expected energy result was achieved.
The dashboard provides a way to verify the outcome using the same measurement system that identified the problem.
What Daitan’s EMS Dashboard Is Intended to Help Managers Do
Daitan Solutions positions its Energy Management System around real-time visibility across electricity and other utilities, from facility level toward individual machines, with centralized monitoring intended to turn raw consumption information into operational decisions.
For factory managers, the practical objective should not be to memorize every electrical parameter displayed by the software. It should be to establish a repeatable method for reading the facility.
Start with total performance.
Compare it with production.
Look at when consumption occurred.
Identify where the change came from.
Investigate the relevant asset or utility.
Determine whether the behaviour was justified.
Take corrective action where necessary.
Then use the dashboard again to verify the result.
Daitan’s existing energy-monitoring projects also demonstrate the value of centralized dashboards for comparing consumption and creating a common view across monitored areas rather than relying on disconnected readings.
The dashboard is therefore not the decision-maker. It is the evidence layer that helps factory managers, engineers, maintenance teams, and management make better decisions together.
Final Thoughts
An EMS dashboard becomes valuable when a factory stops asking, “What numbers are on the screen?” and starts asking, “What does this tell us about how the plant is operating?”
Total kWh tells you how much energy was consumed. Current kW tells you how heavily the plant is drawing power. Energy intensity tells you whether that consumption was reasonable for the amount produced. Load profiles show when energy was used. Department and machine comparisons help locate where changes occurred. Peak-demand views expose concentrated load events. Power factor and power-quality information provide additional electrical context. Alerts draw attention to behaviour that deserves investigation.
None of these numbers should be interpreted alone.
The strongest dashboard habit is comparison: against production, against baseline, against previous shifts, against similar equipment, against operating schedules, and against what the factory expected to happen.
For businesses evaluating energy consumption dashboard software in Pakistan, that is ultimately what should separate a useful industrial EMS from a visually impressive reporting tool. The software should not merely make energy visible. It should help the operating team understand where to look, what changed, why it matters, and whether the action they took actually improved performance.
Turn Your EMS Dashboard Into an Operating Tool With Daitan Solutions
Daitan Solutions helps Pakistani factories build Energy Management Systems around the way their facilities actually operate. This can include smart metering, electricity and utility monitoring, production-level visibility, industrial IoT integration, dashboards, analytics, energy audits, and ongoing engineering support.
If your facility already has energy data but your team is unsure how to turn that information into daily operational decisions, the next step may not be another meter. It may be improving how the existing data is structured, interpreted, and connected to production.
Visit www.daitansol.com to discuss an Energy Management System, dashboard architecture, energy audit, or industrial monitoring requirement for your facility.